
User guide
For readers. How to move around a chart, find what you need, and take a copy away with you.
On this page
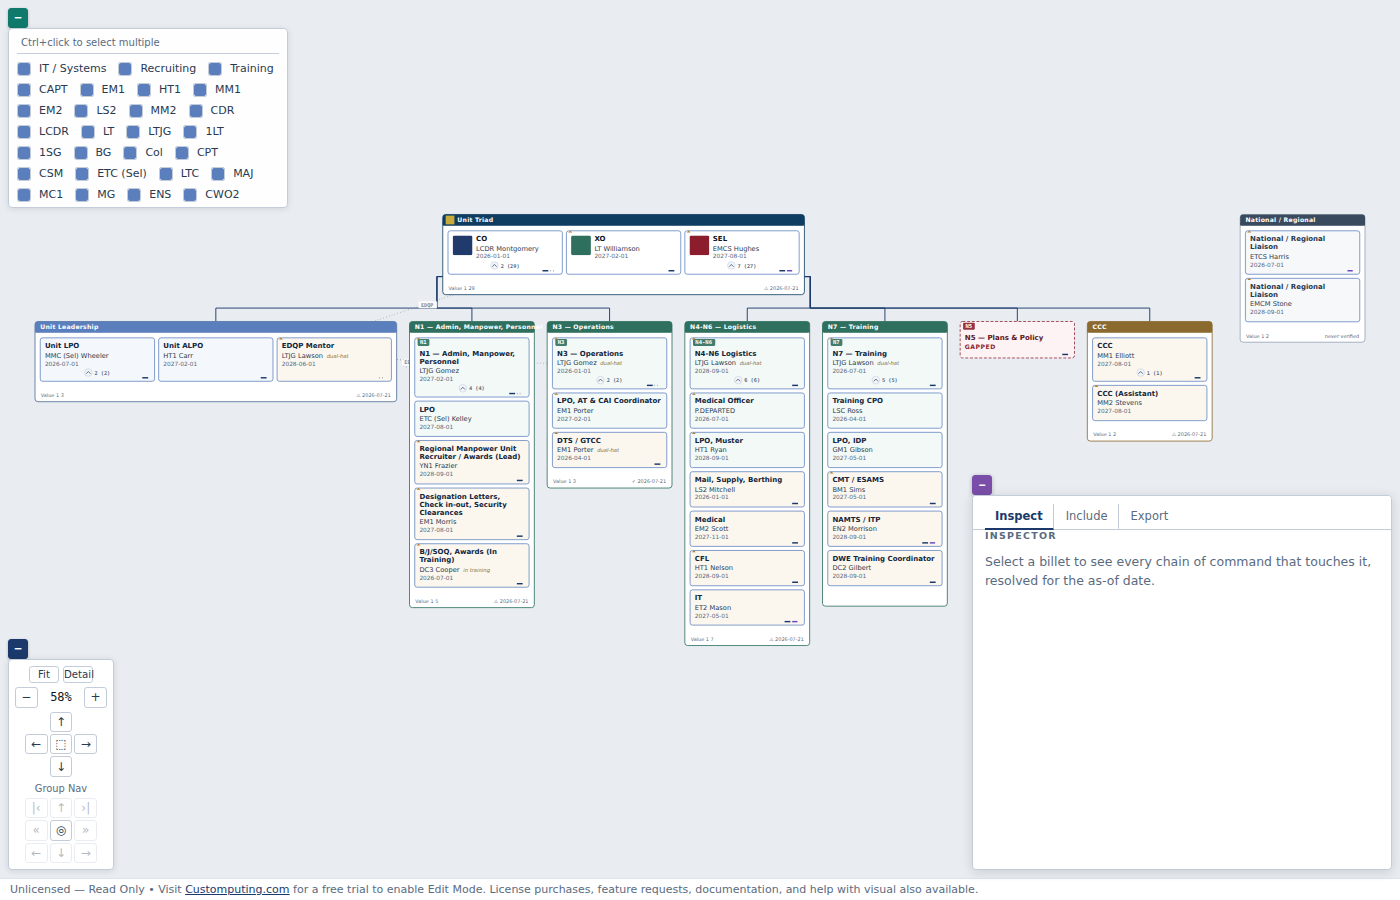
Anatomy of a chart
Each card is a billet. It can show the billet title, a code chip, whoever holds it, detail lines, a photo, and cumulative values. A card with nobody in it is marked GAPPED.
Boxes around cards are groups — a triad, a department, a set of detachments. Boxes nest, and a box can hang beneath a particular billet.
Beneath a card you may see counts and a chevron: 3 (27) means
three people report directly and twenty-seven in total beneath them. The chevron folds that
subtree away and brings it back.
Counts answer "who am I responsible for", not "how many boxes are below". A department head sitting inside their own department box shows the whole department, because those people report to them — even though no box hangs below the card.
The Unassigned pool and flagged assignments
Below some command triads or command leadership groups you may see a small panel listing names — people on the books at that command who aren't currently filling a billet. It updates itself as billets are filled and vacated, so it's always current, not a snapshot. Its categories may be stacked or arranged side by side, depending on the report author's own setting. Not every command necessarily shows one — a report author can turn it off entirely, or hide it for one command specifically.
You may also see a small corner mark on a card, or a similar small box listing several names at once beside a command: both flag a billet whose current holder may no longer be valid — someone who's left the roster entirely, whose own records no longer place them at this command, or whose assignment has an end date that's already passed. Neither is corrected automatically; they're a prompt for someone to check, not evidence of an error in the chart itself.
The side panel and its tabs
Tabs sit at the top of the panel and stay put while the content scrolls.
| Tab | What it holds |
|---|---|
| Inspect | Everything about the selected billet or group: chains, holder, dates, time in role, prior tours, contact details, verification status |
| Include | A tree of the whole chart. Tick and untick to show and hide. Search here too |
| Export | Pictures and data. Always available |
| Edit | Only when the report author has enabled editing |
Inspect
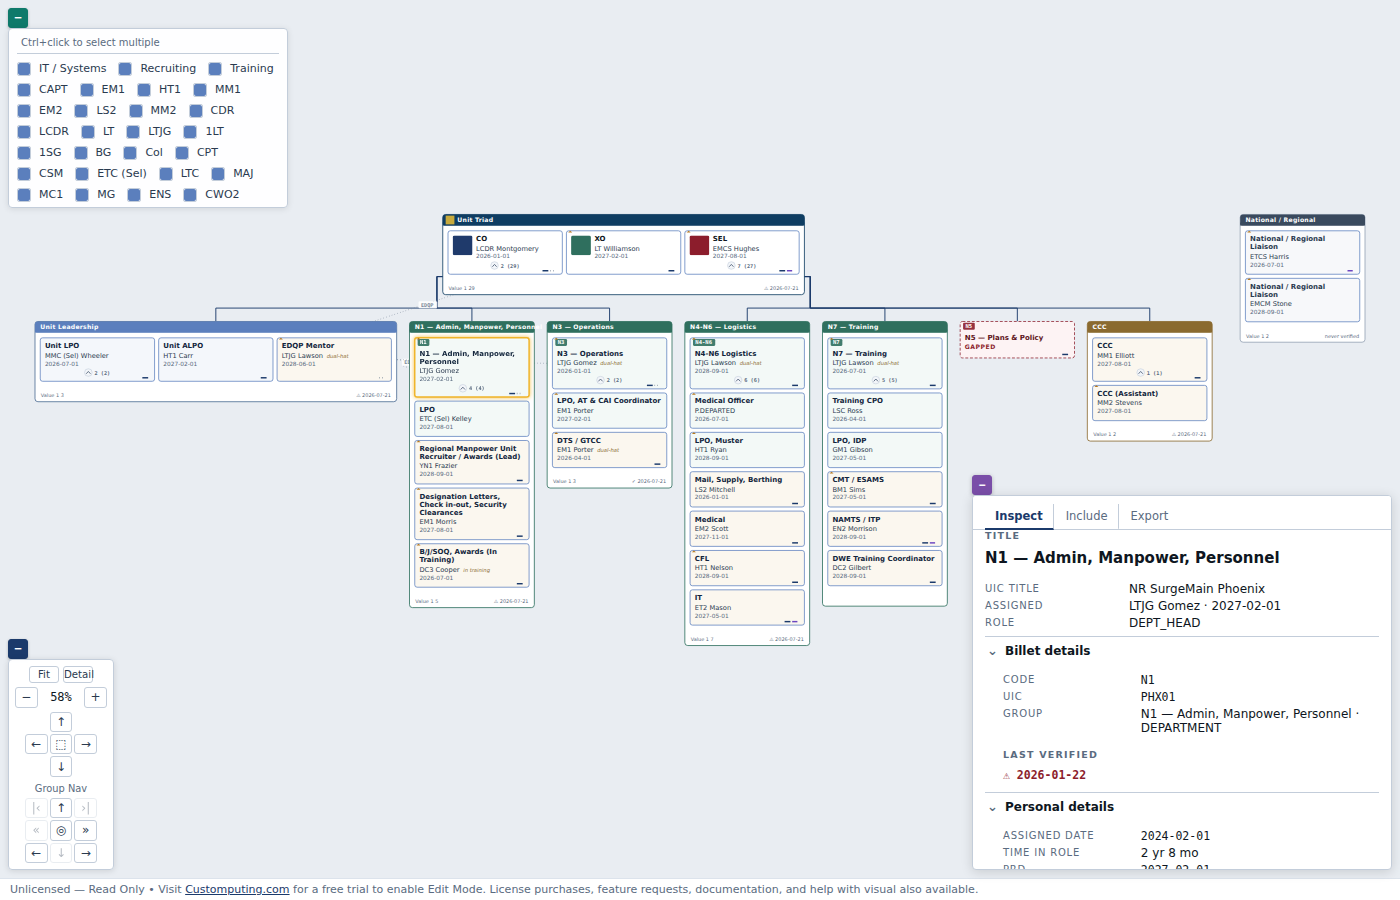
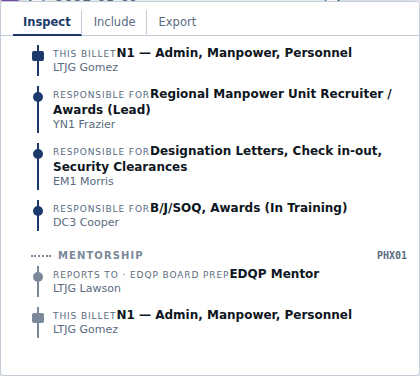
Click any card or box. Inspect shows the chain ladder — who this billet answers to in each chain — along with the current holder, when they were assigned and how long they have been there, plus any earlier tours. If an as-of slider is enabled, it lives here: drag it to see the chart as it stood at another date.
Include
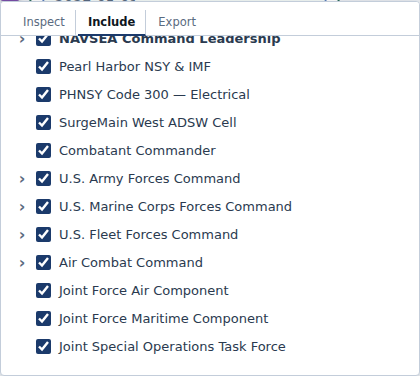
A hierarchy of every group and billet. Unticking a group hides it and everything inside; unticking one billet hides just that one. A group whose contents are all individually hidden still draws as an empty box — hiding the contents is not the same as hiding the container.
Clicking an entry selects it and centres the chart on it, which is usually the fastest way to reach something you can name.
Navigating
Drag to pan, scroll to zoom. The Navigator panel adds:
- Zoom — current percentage, in and out, Fit for the whole chart, Detail for readable size.
- Pan pad — arrows, plus a centre button that returns to your selection.
- Group Nav — a nine-cell pad that moves by organizational relationship rather than screen position.
| Control | Goes to |
|---|---|
| ↑ / ↓ | Parent group / first child group |
| ← / → | Previous / next sibling group |
| « / » | A cousin group — the nearest child of the parent's neighbour |
| ◎ | Cycles the side panels, then the whole chart |
| |‹ / ›| | Previous / next legend-highlighted billet |
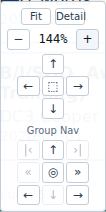
The two corner cells of the Group Nav pad (|‹ and ›|)
step between whatever the legend panel currently has highlighted, rather than between
siblings or children. They're greyed out with nothing selected in the legend, and light up
the moment a legend entry is active:
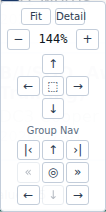
|‹ (Previous highlighted
billet) and ›| (Next highlighted billet) switch from dimmed to
active.Clicking ›| jumps to the next matching billet — pans and zooms the
chart to it, selects it, and opens the Inspector on it — while everything that doesn't
match the legend selection dims so the match stands out. Click it again and it steps to the
next match after that, cycling through every billet the legend selection touches:
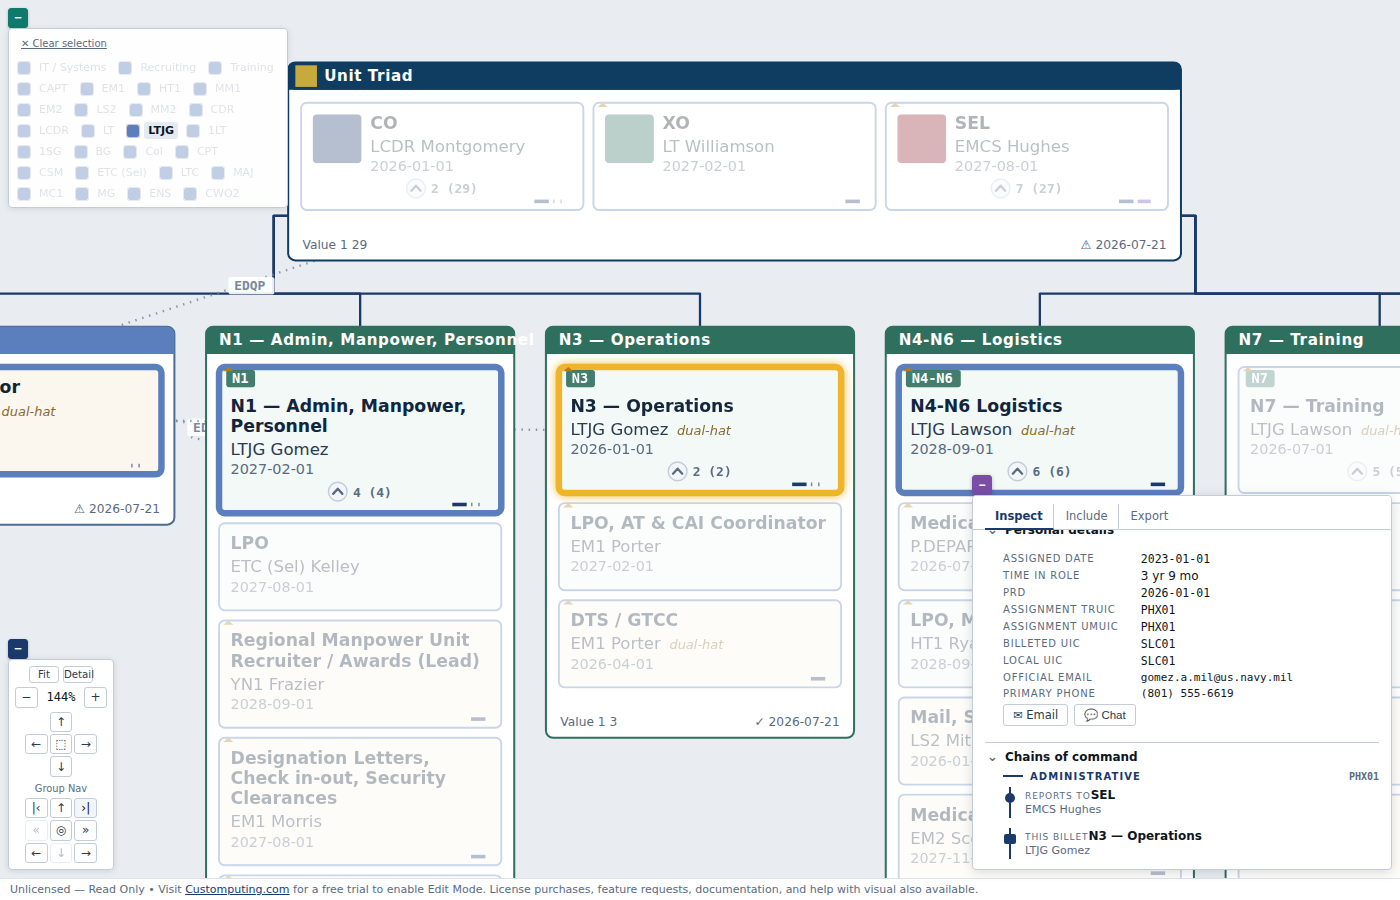
›| landed on N3 — Operations, outlined it,
and opened it in the Inspector. The other LTJG billets visible in this view (N1, N4-N6, N7)
stay highlighted too; repeated clicks step from one to the next.Why organizational and not geometric. The layout engine places boxes differently as the data changes, so a pad that moved "left on screen" would behave differently every time the chart was rebuilt. Moving by structure is predictable.
Finding things
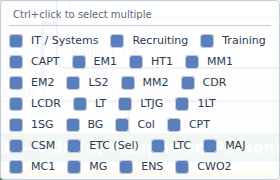
The search box on the Include tab matches billet titles, ids, group names and the person holding the billet — looking someone up by name is at least as common as by role. Matching branches open automatically; you can still fold one away and it stays folded until you change the search term.
Seeing other chains of command
One chain is the spine and determines the layout. The others draw as overlays in their own colours when switched on, with an authority label such as ADCON or TACON where the data provides one.
A thin ribbon on the edge of a card shows at a glance which chains touch that billet, so a dual-hatted officer is visible without turning every overlay on.
Taking a copy
The Export tab offers:
- SVG — vector, the best quality. Pastes into PowerPoint and Word as a resizable picture, and prints to PDF from there.
- PNG and JPG — raster images at 2× scale. Photos embedded on cards are omitted from raster exports.
- CSV — every visible billet with its holder and reporting lines, for Excel.
- Page size — fit the picture to Letter, A4 or Tabloid instead of the chart's natural size.
Exports show exactly what you see. Anything hidden on the Include tab, collapsed, or filtered out is left out of the picture too.